Data integration in glycomics
This section presents the steps needed to integrate biological data within glycomics and with other “omics”.
Glycan formats
Glycans are inherently more complex than nucleic acids and proteins, so defining a format to store the molecular information correctly is not a trivial problem. The complexity of the glycans resides in their branched structure and the collection of building blocks available. In contrast with proteins and nucleic acids which are made of respectively 4 and 20 building blocks, glycans can be built with many different monosaccharides. Additionally, information about monosaccharide anomericity, residues modification and substitution, glycosidic linkages and possible structure ambiguities must be taken into account. Without commenting on the different nomenclatures available to represent each monosaccharide, encoding a glycan structure into a file is required.

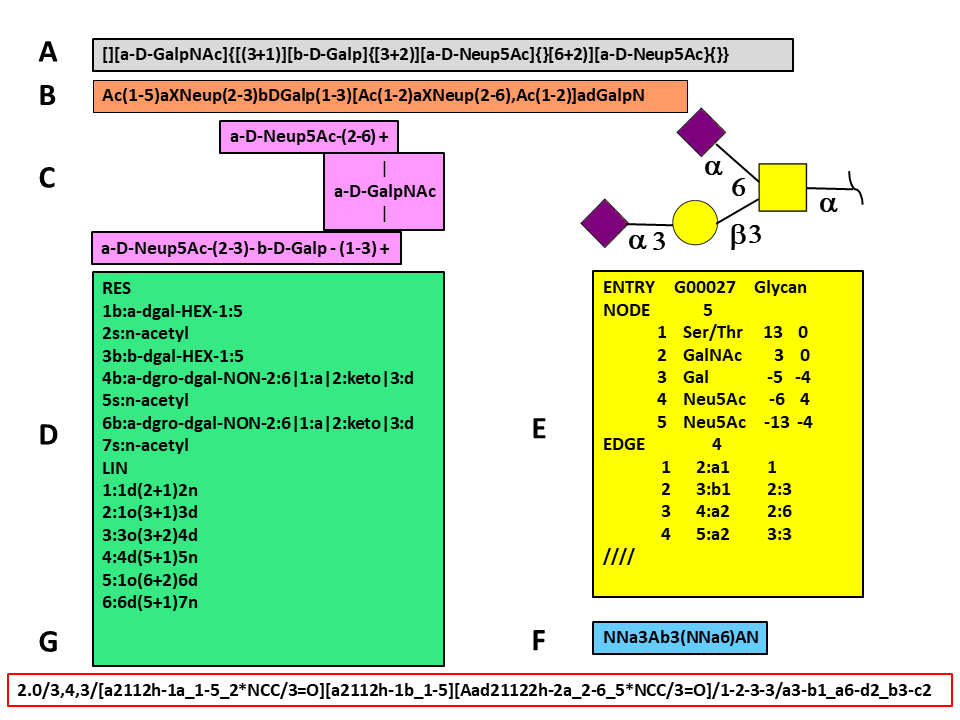
The figure shows an O-glycan (Glyconnect ID 2641) encoded in several different formatsCampbell et al. 2014. Glycan encoding methods can be grouped into three sets according to the technique used to store the data. The first group reduces glycan tree-like structures into linear sequences using strict rules for sorting branches. This group contains Web3 Unique Representation of Carbohydrate Structures (WURCS) Matsubara et al., 2017, the Bacterial Carbohydrates Structure Database sequence format Lütteke 2008.
The figure shows an O-glycan (Glyconnect ID 2641) encoded in several different formats (Campbell et al. 2014). Glycan encoding methods can be grouped into three sets according to the technique used to store the data. The first group reduces glycan tree-like structures into linear sequences using strict rules for sorting branches. This group contains Web3 Unique Representation of Carbohydrate Structures (WURCS) Matsubara et al., 2017, the Bacterial Carbohydrates Structure Database sequence format (Lütteke 2008).
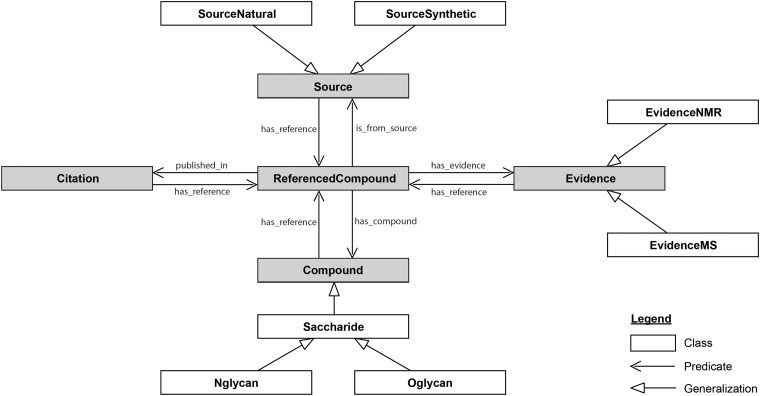
In this situation, ontologies provide a painless way to interconnect resources within glycomics and with other “omics”. As a first attempt, Sahoo et al. generated GlycO, “a glycoproteomics domain ontology for modelling the structure and functions of glycans, enzymes and pathways” (Sahoo et al., 2006). GlycO has a strong focus on the biosynthesis of complex glycan structures and their relationships with proteins, enzymes and other biochemical entities. More recently, Ranziger et al. developed GlycoRDF (Ranzinger et al., 2015). Contrary to GlycO, GlycoRDF has been designed with the precise goal of integrating all the information available in glycomics resources limiting the development of multiple RDF dialects. A detailed diagram of GlycoRDF is given below.

Visualisation
Despite its importance, data visualisation is still a challenge in glycomics. In the last decade, some initiatives have pushed the development of visual tools to improve some aspects of glycan identification and quantification.
Glycoviewer (Joshi et al., 2010) is the first example of data visualisation tool which allows glycoscientists to visualise, summarise and compare different glycomes. GlycomeAtlas (Konishi & Aoki-Kinoshita, 2012), provides an interactive interface for exploring data produced by the Consortium of Functional Glycomics (CFG). To conclude, as stated in its website, GlycoDomainViewer (Joshi et al., 2018) is a visual “integrative tool for glycoproteomics that enables global analysis of the interplay between protein sequences, glycosites, types of glycosylation, and local protein fold / domain and other PTM context”. GlycoDomainViewer integrates experimental data as well as knowledge data sources presenting the most extensive collection of information to explore the possible effect of glycosylation on a protein.
Despite the availability of these and more visual tools, the majority of glycoscientists are still using general purpose applications like Excel to publish experimental results. Therefore, results are hardcoded in figures or text and data is stored in tables which populate the supplemental material section. Additionally, integrative tools like GlycoDomainViewer, although very useful, are usually developed taking into account the needs of a specific research group limiting the possibility of reaching out to the entire community.
