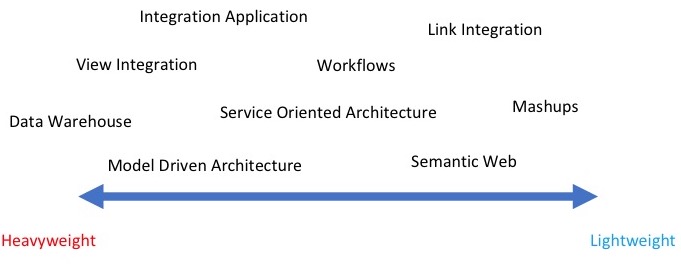
In the last 20 years, software developers have explored a wide variety of methodologies for data integration. Each of this methodology has a technology of reference and uses one or more touch-points. A touch-point is the logical connection between different data sources which make integration possible, for example, data values, names, ontology terms, keywords, etc. In this section we list a few popular approaches that have been identified by Goble et al. These methods show a different level of integration which ranges from light solutions to heavyweight mechanisms.
Service oriented architecture
Service oriented architecture (SOA) is a way to integrate different data sources which can be accessed using a programmatic interface. The beauty of SOA resides in its loose coupling among different resources. The implementation of each resource is entirely masked behind its interface. As far as the interface remains the same, each resource provider can change and expand its resource without causing problems with the rest of the architecture. Usually, SOA relies on technologies like Simple Object Access Protocol (SOAP) and Representational State Transfer (REST) which allow the creation of web services (Dudhe & Sherekar 2014). Due to its simplicity, contrapose to the SOAP verbosity, REST emerged as a de facto standard for service design in Web 2.0 applications (Battle & Benson 2008).
Data sources can be accessed through programmatic interfaces which eradicate the problem of user simulation and screen-scraping. However, the poor stability of web services and the lack of documentation represent the major issues for SOA which leads to the impossibility of using the corresponding data.
Link integration
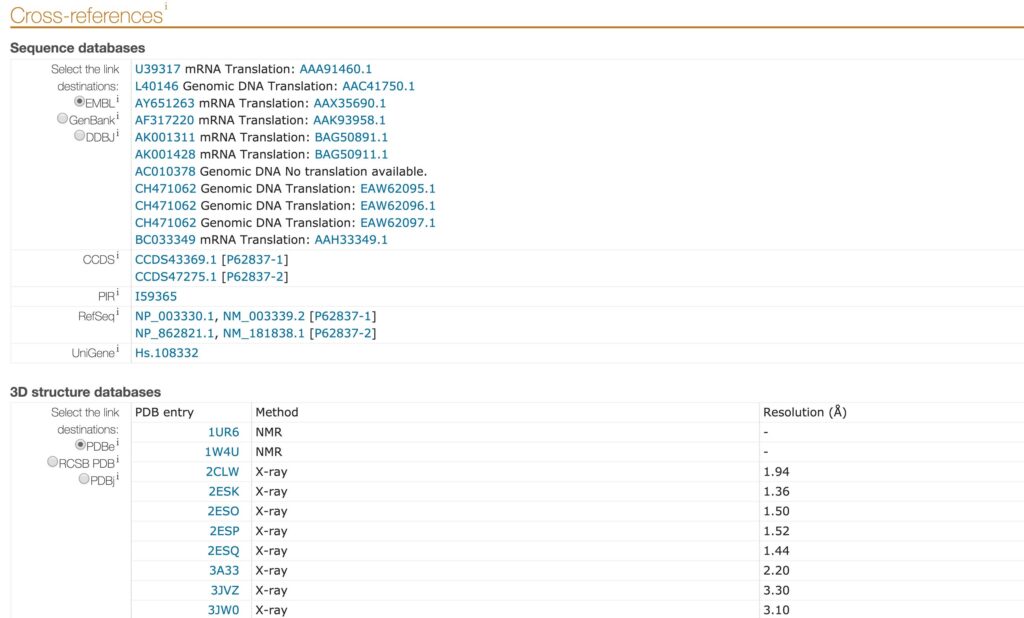
Link integration is a technique where an entry from a data source is directly cross-linked to another entry from a different data source. Because many data sources are websites and subsequently, entries are web pages, link integration can be renamed hyperlink integration. Users can navigate among different data sources using the hyperlinks present in each web page. The Uniprot “Cross-references” section, available in each entry, represents an example of link integration. In this section, a list of links connects the entry to sequence databases, 3D structure database, etc (Figure 4). Link integration is broadly used in bioinformatics and can be seen as a lite integration technique. This method relies on service provider agreement, and it is vulnerable to name clash, updates and ambiguous cases (Goble & Stevens 2008).
Data warehousing
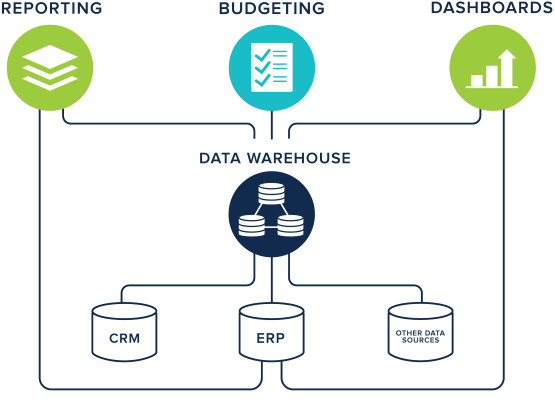
The data warehousing technique has its root in many companies. All the data produced within an organisation is extracted, transformed and loaded (ETL) into a new general data model (Figure 5). In this combined shape, data can be analysed to provide useful strategic information for business intelligence (Ponniah 2004). Data is stored and queried as a monolithic, integrated resource which relies on a predefined schema. In contrast to the previous methods, data warehousing represents a heavyweight mechanism for data integration. Due to the initial high costs of implementing a data warehouse and the fixed model, which can hardly change with time, this technique failed to last in life science applications. This method is well-suited for companies which have the control over data production but becomes particularly unsafe when data is produced by third parties who potentially and unpredictably change their model at any time. When one or more data sources cannot be synchronized with the data warehouse, the only solution is to redesign the underlying data model from scratch, which is costly. A recent example of a data warehouse in bioinformatics is Geminivirus.org (Silva et al. 2017).
View integration
View integration is based on the same concept as data warehousing without providing a monolithic integrated resource. In this methodology, data is kept within the sources that are integrated on fly to provide a fresh integrated view. Users have the illusion of querying a unique resource, but, in the background, data is pulled from the several sources using ad-hoc drivers (Halevy 2001). The mediated schema of the view is defined at the beginning like in data warehousing, but drivers can be adapted to support changes in the data sources. However, drivers tend to grow with time making the maintenance more and more complicated. Additionally, the overall performance can be an issue since, in the view integration, the query speed is limited by the slowest source of information. TAMBIS (Stevens et al. 2000) can be considered the first example of view integration in bioinformatics. This software application was able to perform tasks using several data sources and analytical tools. TAMBIS used a model of knowledge built by a list of concepts and their relationships. However, the tool is not maintained anymore.
Model-driven service oriented architecture
The model-driven service oriented architecture represents a hybrid technique which combines SOA and the integration view. Usually, this methodology is used by notable projects which are able to define a common data model for a particular context. In this way, data producers can join the infrastructure only if they are fully compliant with the predefined model. One example of model-driven SOA is caCORE, a software infrastructure which allows the creation of “interoperable biomedical information systems” (Komatsoulis et al. 2008). Using caCORE, scientists can access (syntactic interoperability) as well as understand (semantic interoperability) the data once it has been retrieved. caCORE has been used to create the cancer Biomedical Informatics Grid (caBIG) which consist of a data grid system where scientist can publish and exchange cancer-related data. In 2012, caBIG was followed by the National Cancer Informatics Program.
Integration applications
Integration applications are special tools designed to integrate data in a single application domain. Contrary to view integration and data warehousing, integration applications are far from being general integration systems. Software developers tailor the application according to the needs of a specific sub-field. In this way, the application is well suited to a specific application domain, but it cannot be transposed in another field. Due to their custom implementation, integration applications are usually a mix of several data integration methodologies. An excellent example of this technique is EnsEMBL (http://www.ensembl.org/) genome database project (Zerbino et al. 2018). EnsEMBL is a genome browser built on top of an open source framework which can store, analyse as well as visualise large genomes. It provides access to an automatic annotation of the human genome sequence which is based on several external data sources.
Workflows
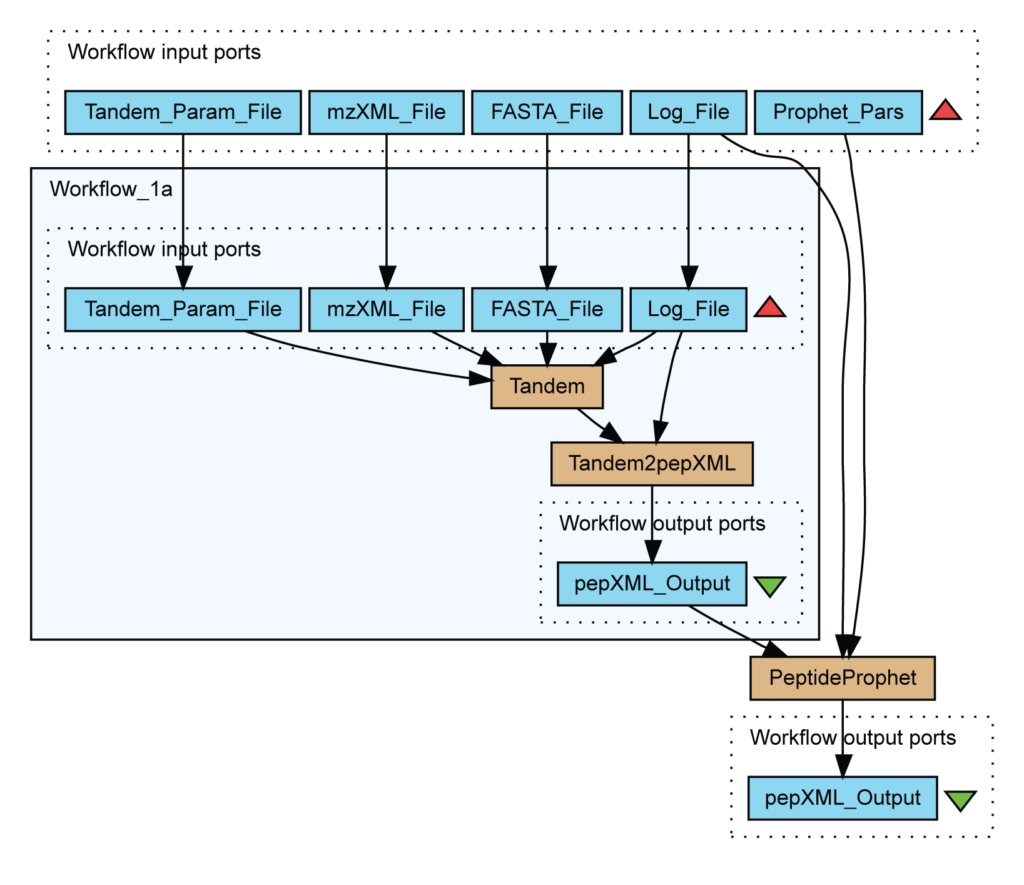
In particular, this workflow identifies peptides from mass spectrometry data using X!Tandem and validates assignments with PeptideProphet.
In data integration, a workflow describes the set of transformations which are applied to the data. A workflow can be built using a set of custom scripts or taking advantage of one of the workflow management systems available. When software like Knime (Fillbrunn et al. 2017), Apache Taverna (Oinn et al. 2004) or Galaxy (Afgan et al. 2016) are used, researchers can perform in silico experiments without becoming neither a software developer nor a scripting language expert (Karim et al. 2017).
Contrary to data warehouse and integration view, the integration process is defined by a series of transformations which are publicly exposed. Figure 6 describes a workflow for the identification of peptides in mass spectrometry data. Light blue boxes are file inputs whereas brown boxes are running scripts like PeptideProphet.
Workflows can cope with unreliable data sources, and they can be adapted to face changes in data production. However, they are not the solution to every problem since the design of a workflow can be hard and its quality is strictly bounded to the data sources they integrate.
Mashups
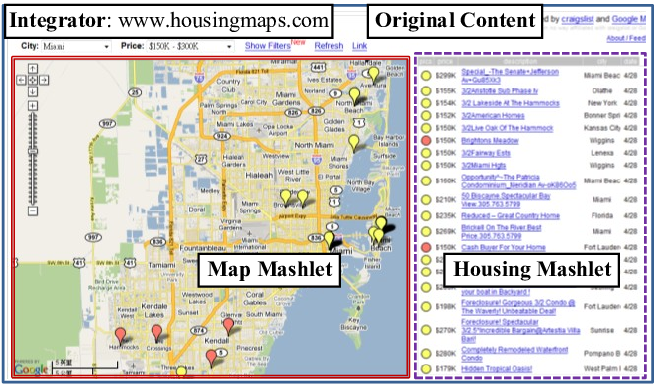
All the methodologies proposed, except for link integration and workflows, require robust database and programming expertise. For some techniques, changing the data model or adding new data sources represent significant issues. For this reason, with the start of the Web 2.0, mashups have emerged. A Mashup is a web page or a web application where a collection of data sources are combined to create a new service. To create a mashup, we identify possible data sources that can be integrated to produce a novel functionality. Figure 7 shows a mashup done by integrating Craigslist apartment and housing listings (on the right) onto Google Maps.
Mashups provide a lite integration which is closed to aggregation more than integration. However, they produce useful lightweight applications which can be quickly built in a short amount of time with limited expertise. Mashup tools like Pipes (https://www.pipes.digital/) use a graphical workflow editor to bridge web resources easily. Data visualisation tools like Google Maps and Google Earth offer the possibility to display and combine georeferenced data on this principle as well.
The Semantic Web and RDF
The semantic web, even defined as the web of data, “provides a common framework that allows data to be shared and reused across application, enterprise, and community boundaries” (W3C Semantic Web Activity Homepage, n.d.). It is based on the Resource Description Framework (RDF), which consists of a standard model for data interchange on the web. The graph-based structure, provided by RDF, is responsive to change and support semantic descriptions of data. All data in RDF are in the form of triples, i.e., statements always composed by a subject, a predicate and an object. Each of these resources is identified by a Uniform Resource Identifier (URI) or a blank node. The latter identifies anonymous resources which can only be subjects or objects. Referring data with the same URI across several data sources, when these are semantically equal, allows the creation of touch points. As mentioned earlier, touch points are the connection of multiple knowledge graphs and allow the creation of integrated resources.
To store data in an RDF endpoint, it is necessary to draft an ontology which can be described using the RDF Schema (RDFS) or the Web Ontology Language (OWL). Additionally, ontologies are helpful to understand the graph structure of resources and to link resources which have shared information. Once data are stored in the triple store, SPARQL, a SQL-like query language, is used to retrieve data from each resource. Using federated queries, SPARQL interacts and retrieves data from multiple connected data sources. The logic is masked to the user who interacts only with one single interface.
To conclude, publishing data using RDF allows connecting different data sources that have one or multiple touch-points. The ultimate goal of the semantic web is to have a single web of connected endpoints which can be queried as a single resource. Cmapper, for example, is a web application that allows navigating all EBI RDF endpoint at once using the gene name as touch point (Shoaib, Ansari, & Ahn 2017).
