
3D porous structures of nanocellulose
There is an increasing wish for scaffolds in the biomedical, energy and thermal insulation fields. Nanocellulose 3D porous structures have been prepared to meet this need. In a recent review by De France et al. (2017), the preparation processes and material properties of CNC and CNF aerogels were described. A thorough review of the literature is presented in tables. It helps to identify the type of nanocellulose and the drying process to choose depending on the targeted properties and applications. The review also emphasizes the lack of systematic studies on the effect of the properties of nanocellulose (aspect ratio, size, surface chemistry, etc.) on the resulting properties of the materials. It identifies the variability of the nanocellulose starting materials as the main drawback for the commercialization of nanocellulose porous structures, as differences emerge from one batch to another, especially with the increasing number of nanocellulose producers.
Processes to generate nanocellulosic solid foams are selected to produce structures with controlled porosity, good mechanical properties and high specific surface area (SSA). Solvent removal from a nanocellulose suspension can be carried out through different drying pathways to obtain a porous structure. Two main techniques have been described for the production of nanocellulose porous materials: freeze-drying and supercritical drying. Because of the great impact of the process on the generated porous structure morphology, it is necessary to use an adequate terminology. The term cryogels refers to freeze-dried structures. This process involves the sublimation of a suspension of nanocellulose in water or in tert-butyl alcohol, which was previously frozen. The term aerogel will be restricted to porous structures that have been dried under supercritical conditions although, in the literature, it is commonly used to describe both types of structures. Before aerogel production, the first step of solvent exchange to a solvent miscible with both water and carbon dioxide is necessary, and ethanol is commonly reported as the solvent used to meet these requirements. The different production pathways of cryogels and aerogels are illustrated in Figure 9.
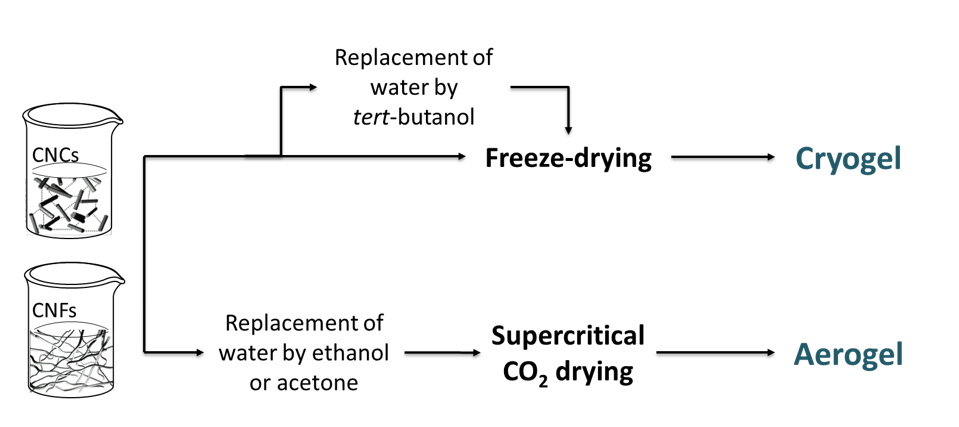
Figure 9: Solvent removal pathways during cryogel and aerogel production.
The main challenge for the production of nanocellulose-based cryogels and aerogels is to maintain the porous structure and avoid pore collapse. For that purpose, it is necessary to avoid capillary pressure induced during sample evaporation. This stress is initiated at the water-gas interface and can be avoided by bypassing the triple point or the critical point. In Figure 10, the phase transition of water or tert-butyl alcohol during freeze-drying and of carbon dioxide during supercritical drying is shown in a phase diagram. The liquid-gas phase transition, in red on the diagram, is not crossed but avoided by going through the solid or supercritical state.
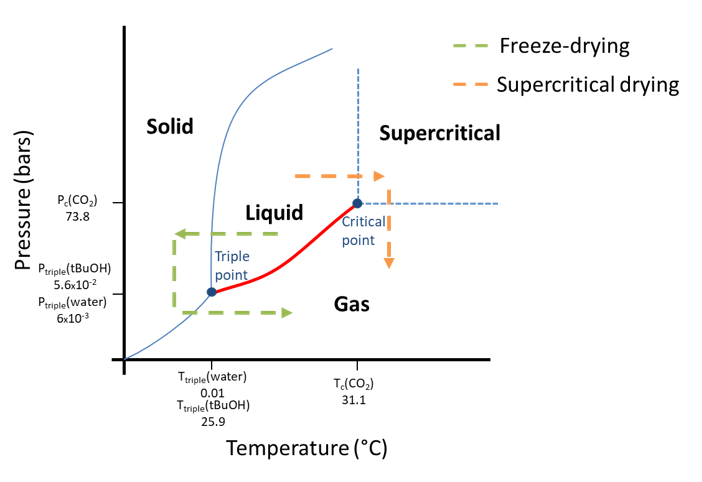
Figure 10: Phase evolution of solvent (water or CO2) during freeze-drying and supercritical drying.
Freeze-drying of cryogels: challenges and solutions
Freeze-drying is a simple and efficient method to produce nanocellulose porous structures. The pore size and morphology can be tuned by playing on the processing parameters. Freeze-drying of a nanocellulose suspension can be performed with or without prior solvent exchange. A recent review by Gupta et al. (2018) discussed the progress and understanding of nanocellulose freeze-drying and described the influence of the processing parameters and the suspension formulation on the final properties of the materials.
Cryogels prepared from aqueous nanocellulose suspensions exhibit a typical sheet-like morphology. The dense walls observed result from the growth of ice crystals pushing the objects away and together, therefore forming dense regions of nanocellulose particles. The ice crystals nucleation is an important parameter to monitor to control and tune the cryogel morphology.
Two freezing procedures are distinguished: homogeneous freezing and unidirectional freezing. A schematic representation of a typical setup used for homogeneous and unidirectional freezing, the induced orientation of the cellulose nanoparticles and the crystal growth during freezing and the resulting pore morphology are depicted in Figure 11. Homogeneous freeze-drying, freeze-crashing or regular freeze-drying are the terms used to describe a freezing step with uniform temperature throughout the sample, which is considered to produce tunable and homogeneous pore sizes. On the other hand, unidirectional freezing can be performed to orient the pores in a specific direction and obtain lamellar structures. Instead of introducing the nanocellulose suspension in a liquid bath at low temperature, the freezing is induced from the bottom of the aqueous suspension. Different methods establish a temperature gradient. Ice-templating or freeze-casting are terms used to describe this method. The most common strategy is to deposit the mould filled with the suspension on a cold surface. This “cold finger” setup has been widely used (Donius et al. 2014; Wicklein et al. 2015; Munier et al. 2016; Chu et al. 2017) and is illustrated in Figure 11b. Pre-cooling of the suspension is often performed before freezing (Sehaqui et al. 2010b; Zhang et al. 2014). Molds with different thermal conductivities were also designed for this purpose (Jiménez-Saelices et al. 2017b). Anisotropic pores are produced parallel to the freezing direction, and the resulting cryogel presents a cellular organization. The establishment of the temperature gradient can also lead to the presence of a pore size distribution fluctuating along the direction of freezing. Buchtová and Budtova analyzed the pore sizes of cryogels prepared from dissolved microcrystalline cellulose (Buchtová and Budtova 2016). From SEM images of the cryogel parts, close to the bottom, in the centre and close to the top, an increase of the mean pore size from 4.3 to 7.5 µm was observed. In their work, Munier et al. compared the conventional freeze-drying (homogenous freezing) with the freeze-casting (unidirectional freezing) methods with both CNFs and CNCs (Munier et al. 2016). They quantified the degree of orientation and they observed a slightly higher orientation index for CNC cryogels, induced by the alignment of the CNCs in the freezing direction.
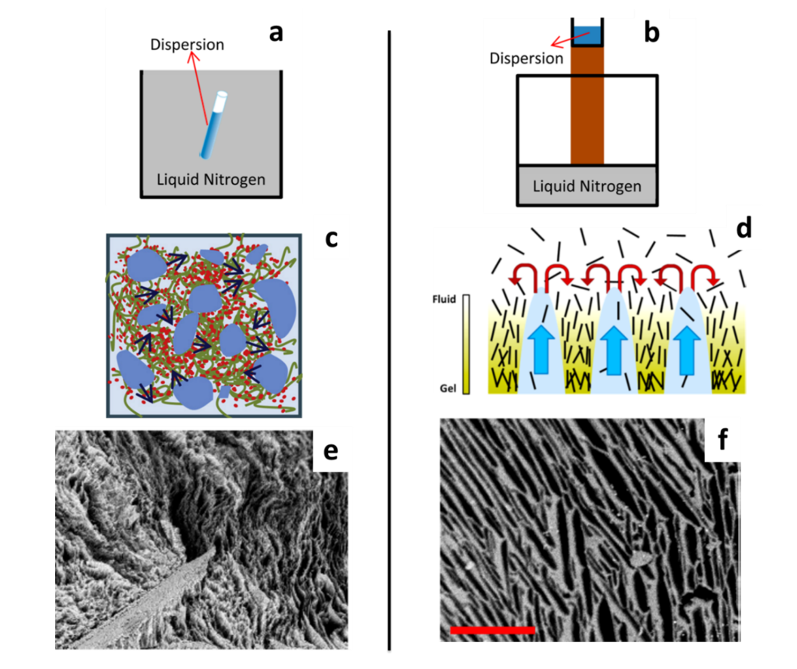
Figure 11: Schematic representation of homogeneous and unidirectional freezing of the nanocellulose suspension (a, b) and particle orientation during freezing (c, d). SEM image of the CNF freeze-casted cryogels (e) and CNC cryogel anisotropic pores (f). Images e and f are in the same magnification, scale bar: 200 µm. Adapted from (Munier et al. 2016; Zhang et al. 2019)
Jin et al. were among the first to prepare freeze-dried nanocellulose cryogels from cellulose nanofibrils dissolved and regenerated in aqueous calcium thiocyanate (Jin et al. 2004). They compared different freezing conditions: immersion in liquid nitrogen, contact with a pre-cooled metal plate, and after solvent exchange to tert-butyl alcohol. The higher the temperature, the lower the freezing rate and the larger the size of the pores in the cryogel. The nucleation of ice crystals is slower than the solidification speed. The interconnectivity of the pores is affected by the freezing conditions; usually, oval pores are observed after fast solidification, while interconnected or dendritic pore structures are observed with slow solidification (Li et al. 2012b).
The effect of the freezing time on the resulting cryogel morphologies was investigated by Martoïa et al. (2016). Different liquids were used to prepare cooling baths at temperatures from -13°C to -114°C and the CNF suspensions solidification times were varied from 20 to 3 minutes. As well as the cooling rate, they investigated the effect of the CNF type (enzymatic or TEMPO-oxidized) and concentration. Higher mechanical properties and more regular anisotropic pores were achieved with TEMPO-oxidized CNFs. Although the cooling rate could be used to control the pore size, this method was not efficient to modulate the shape and orientation of the pores generated. Mechanical stirring during solidification had to be used to enhance the mechanical properties of the cryogels.
In addition to the freezing conditions, the solvent plays a major role in the resulting properties and morphologies of the cryogel. Instead of observing large pores and flat walls, cryogels obtained after solvent exchange to tert-butyl alcohol (tBuOH) exhibit smaller pores (below 1 µm) and a finer network (Sehaqui et al. 2011b; Nemoto et al. 2015). Because the fibrillary network is better preserved, solvent exchange to tert-butyl alcohol generates cryogels with much higher specific surface areas. Introduction of tert-butyl alcohol limits the growth of ice-crystals, hence the increased specific surface area. Additionally, it was mentioned that tert-butyl alcohol could bind to the surface of cellulose, limiting the hydrogen bonding between the nanocellulose objects by creating steric hindrance and therefore limiting aggregation (Jiang and Hsieh 2014). Nemoto et al. prepared cryogel of TEMPO-oxidized CNFs with an increasing amount of tert-butyl alcohol from 0 to 20 % and the specific surface area increased from 94 m².g-1 to 319 m².g-1 for a 20 % tert-butyl alcohol concentration (Nemoto et al. 2015). Sehaqui et al. prepared cryogels after a solvent exchange with a specific surface area of 153 m².g-1 with CNFs and 284 m².g-1 with TO-CNFs (Sehaqui et al. 2011a). Fumagalli et al. prepared cryogels of cotton CNCs with increasing amounts of tert-butyl alcohol from 0 % to 80 % and observed an increase of SSA from 17 to 167 m².g-1 (Fumagalli et al. 2013). These results are explained by analyzing the phase diagram of the binary mixture of tBuOH and water. It was reported that mixtures of 20 % and 90 % in tBuOH behaved as a eutectic solvent and yielded the smallest crystal sizes (Kasraian and DeLuca 1995). The crystal morphology is greatly influenced by the formation of various tBuOH hydrates at different concentrations (Tang et al. 2016).
Supercritical drying of aerogels . Supercritical drying, also known as critical point drying, is used for the preparation of nanocellulose porous materials. Supercritical carbon dioxide presents the advantage of having mild supercritical pressure and temperature (7.39 MPa and 31.1°C, respectively). The great interest of the process lies in the very high specific surface area that can be achieved. The absence of surface tension of carbon dioxide in the supercritical state reduces the risks of pore collapse. This process maintains the nanoscale dimensions of the nanocellulose and efficiently preserves the porous structure. However, the procedure often requires time-consuming solvent exchange steps, expensive high-pressure equipment, and scale-up is complicated.
Kistler published the first study on cellulose aerogels in 1932 (Kistler 1932). However, it is not until 2001 that Tan et al. studied the production of cellulose aerogels from cross-linked and de-esterified cellulose acetate (Tan et al. 2001). They obtained aerogels with high specific surface areas up to 389 m².g-1. As a comparison, silica aerogels exhibit specific surface areas around 800-1000 m².g-1, and higher values are sometimes reported. Many studies reported the formation of aerogels with dissolved cellulose, while only a few works considered nanocellulose particles. Hoepfner et al. prepared aerogel from cellulose dissolved in hydrated calcium thiocyanate melt (Hoepfner et al. 2008). The resulting aerogels were homogeneous and presented a specific surface area of 250 m².g-1. When compared to conventional freeze-dried cryogels, aerogels exhibited high surface areas and were less brittle than cryogels, which often exhibited cracks. Cellulose aerogels obtained from the supercritical drying of a solution of cellulose in LiOH/urea were compared to freeze-dried cryogels (Cai et al. 2008). The aerogels presented a much higher specific surface area (392 compared to 332 and 142 m².g-1 for cryogels with or without prior solvent exchange). Moreover, aerogels were stronger and maintained their original shape. Microcrystalline cellulose aerogels were produced by Wang et al. (2016) with good preservation of the original network and high specific surface area of 353 m².g-1. The impact of several cellulose solvents on the pore and solid structure of aerogels has been investigated by Pircher et al. (Pircher et al. 2016). An increase in cellulose II crystallinity was achieved by using solvents that yield to the formation of ordered domains before cellulose coagulation, including Ca(SCN)28H2O/ LiCl (46–50 %) or NMMO.H2O (24–27 %). Aerogels obtained from tetrabutylammonium fluoride exhibited a specific surface area of 328 m².g-1 and the highest compressive stress rigidity, due to a more uniform morphology, smaller fibrils diameter, and small pore sizes. Transparent and ordered cellulose II aerogels were produced by Plappert et al. (Plappert et al. 2018) in an approach where the regeneration of cellulose was achieved by decelerated coagulation. Cellulose solutions in [TMGH][OAc], a supercooled ionic liquid, was used in this purpose. The formation of aerogels with dissolved cellulose and cellulose II is discussed in a recent review by Budtova (2019).
Heath and Thielemans prepared cellulose nanocrystals aerogels with very high surface areas up to 605 m².g-1. Still, they reported high variability, from 206 to 605 m².g-1 without a clear correlation between the CNC concentration and the specific surface area (Heath and Thielemans 2010). Similarly, Buesch et al. reported specific surface area up to 429 m².g-1 for TEMPO-oxidized CNC aerogels and performed TEM tomography on coated samples revealing randomly oriented CNCs (Buesch et al. 2016). Cellulose nanofibril aerogels were prepared by Korhonen et al. (2011) and Ciftci et al. (2017) and compared with cryogels. Once again, higher specific surface areas were reached with scCO2 drying. Images of the discussed aerogels are presented in Figure 12.
Because water and CO2 are immiscible, the first step of aerogel preparation involves a solvent exchange to an organic solvent miscible with supercritical CO2. Usually, dehydration of the suspension is performed with ethanol bathes of increasing concentration until water is removed. The suspension is then placed in the pressurized chamber and ethanol is replaced by liquid CO2. The pressure is set above the liquid state of CO2, and the temperature is kept low (below 31°C). Finally, the temperature is increased to reach the supercritical state, and when the pressure is decreased, the aerogel is formed.
In the literature, nanocellulose aerogels preparation was performed under mild conditions, commonly at a temperature of 40 °C and a pressure from 10 to 12 MPa. The preparation time varied from 30 minutes to over 1 day (Cai et al. 2008; Heath and Thielemans 2010; Buesch et al. 2016; Ciftci et al. 2017). A flow of carbon dioxide during the preparation process has sometimes been reported; for example, a flow of 0.5 L.min-1 was used by Ciftci et al. (2017). To reduce the cost of the process, it is essential to optimize the drying conditions.
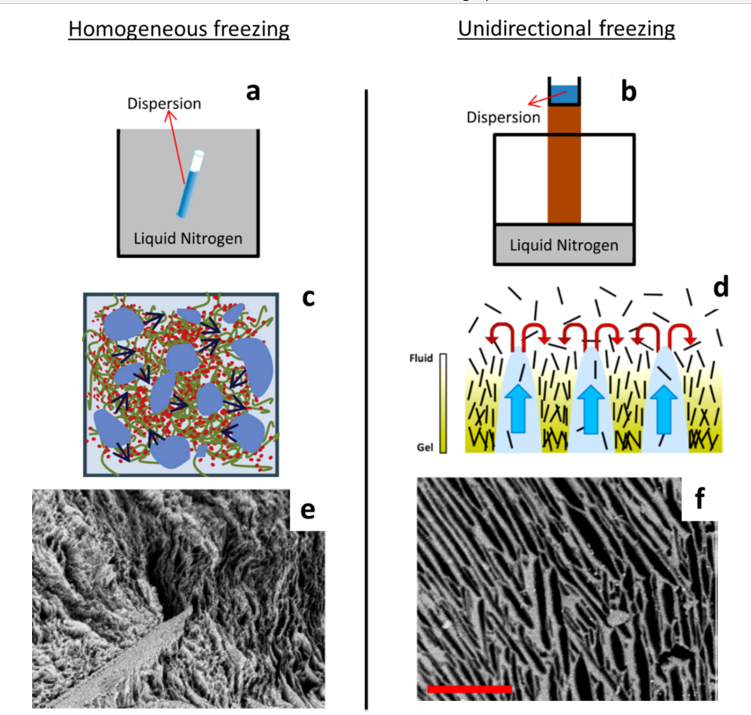
Figure 12 a: 3-D TEM tomography view of TEMPO-oxidized CNC aerogels (in green the CNCs, in blue the Al2O3 coating) (Buesch et al. 2016), b: SEM image of cotton CNCs aerogels (Heath and Thielemans 2010), c: SEM image and a corresponding photograph of CNF aerogel (Ciftci et al. 2017).
Şahin et al. published a list of recommendations and considerations for supercritical drying of aerogels. Most literature is based on silica aerogels; however, there has been recent and growing interest in biopolymer aerogels (Şahin et al. 2017). The study and understanding of kinetic aspects are important for scaling up and speeding up the process but also to gain information about the porosity or the capillary forces applied.
During the pressurization step, CO2 enters the pressurized chamber, and a CO2/ethanol system is formed. When the gas (CO2) dissolves in ethanol under high pressure, the volume increases considerably compared to the initial solvent volume. This phenomenon is known as gas expanded liquids (Kordikowski et al. 1995). Bueno et al. provided evidence that the expanded liquid mixture of CO2 and ethanol resulted in spillage out of the gel (Bueno et al. 2018). They suggested that it was possible to improve the solvent removal kinetics by operating at low temperatures and therefore in the sub-critical region (the lower regions near the supercritical state).
Although the value of the depressurization rate is very rarely mentioned in cellulose aerogel production protocols, this step plays a major role in the porosity and morphology of the aerogel (Sanz-Moral et al. 2014). During this last step of the process, the pores are filled with supercritical carbon dioxide, and when the pressure is dropped, scCO2 flows out of the pores and enters its gaseous state. If pressure drops too rapidly, the pressure outside the pores will be higher than inside, since the pore filling CO2 will not be able to flow out of the complex pore network with the same rate. As a result, when the depressurization rate is set too high, shrinkage and cracking can occur (Şahin et al. 2017). The depressurization step significantly affects the aerogel shape and porosity (A. Kenar et al. 2014; Scherer 2019) and therefore, must not be arbitrarily set. To reproduce aerogels within different production sites, the rates of pressurization/depressurization and the CO2 flushing amounts inside the chamber must be controlled and reported.
Characterization of nanocellulose porous structures . Nanocellulose cryogels and aerogels have been produced from cellulose nanocrystals and cellulose nanofibrils and with two main types of processes: freeze-drying and critical point drying. Various characterization techniques have been employed in order to assess the different properties and morphologies of the nanocellulose porous structures as well as the quality and efficiency of the solvent removal process.
Density . The density depends on the suspension initial concentration and gives information on the drying process and potential expansion or shrinkage phenomenon. It is determined gravimetrically by weighing the material and measuring its volume with a digital calliper. The porosity of the material is deduced from the density of the nanocellulose cryogel or aerogel, dm, and the density of crystalline cellulose, dc, as described in Equation 1.
P(%)=1-dm/dc × 10 Equation 1
Pore morphology. The pore morphology is greatly influenced by the processing method (freeze-drying, supercritical drying) and its conditions (cooling rate, solvent exchange, pressurization, depressurization rate etc.), as well as the type of nanocellulose and their interactions. The shape of the porous organization is most commonly studied by scanning electron microscopy after coating with a conductive layer of metal. X-ray microtomography or 3D tomography is another powerful tool for pore shape assessment. The mercury porosimetry technique involves a sample being immersed in mercury. For mercury to penetrate the pores of the material, pressure must be applied. The porous cryogel or aerogel are being compressed, and therefore the pores are deformed. Moreover, with pressure increase and aerogel compression, there is a risk that the non-wetting liquid, mercury, is not entering the pore network and that pore volume is underestimated. Rudaz et al. observed that around 60 % of the pore volume was considered with mercury porosimetry (Rudaz et al. 2014). The BJH (Barrett et al. 1951) theory has been used to deduce pore size distribution and pore volume, from the nitrogen desorption isotherm. It is a Kelvin-based model (describing the change in vapour pressure due to a curved liquid-vapour interface), and a bulk condensation behaviour is assumed in the calculation. New models, such as density functional theory (DFT) and nonlocal density functional theory (NLDFT), take into account factors of adsorbate-adsorbent interaction as well as pore geometry. They are, therefore, considered more precise and reliable. However, the adsorption methods are available for a very narrow pore size range (usually from 2 nm to about 100 nm) and consider only a small part of the porosity. Thermoporosimetry and cryo-porosimetry methods are used to measure porosity and pore sizes. They are based on the Gibbs-Thomson effect that describes crystals of liquids confined in pores melt at lower temperatures than the normal melting temperature of the liquid. The shift of melting temperature is inversely proportional to the pore size in which the liquid is entrapped. The melting point is detected either by differential scanning calorimetry (DSC) for thermoporosimetry measurements or by neutron scattering for cryoporometry measurements. Thermoporosimetry was proven efficient, and a good alternative to nitrogen adsorption or mercury porosimetry methods to characterize the porosity of cellulose aerogels and a good correlation with pore sizes observed by microscopy images was reported by Pircher et al. (2015, 2016).
Specific surface area. The specific surface area is an essential property to study and is defined as the total surface area of a material per unit of mass. High specific surface areas are generally desired and observed when cryogels and aerogels are produced. Several techniques have been developed for specific surface area measurements such as gas permeability, methylene blue staining or protein retention method. The most commonly used is the adsorption-based BET method. Brunauer, Emmett and Teller described the multilayer adsorption of nitrogen on surfaces in 1938 (Brunauer et al. 1938), which is an extension of Langmuir’s theory. The adsorption of gas (traditionally nitrogen) at cryogenic temperatures is measured as a function of relative pressure. For BET measurement, the amount of adsorbate corresponding to a monolayer of gas is calculated to deduce the accessible surface area of the material.
Mechanical properties. Compression testing experiments assess the mechanical properties and Young’s modulus. Gibson and Ashby described the typical stress-strain curve of cellular material (Gibson and Ashby 1999). Also called “lattice”, cellular materials present an organization such that strong and stiff materials can be prepared with a little amount of material and lightweight. The compression curve presents an initial linear part at strain lower than 10 %. From this elastic region, Young’s modulus can be calculated from the following formula: E=σ/ε where E is Young’s modulus in Pa, σ is the stress in Pa and ε is the strain. A plateau corresponding follows the linear part to pore collapse or buckling and a final densification region.