9.1. Molecular Weight.
A complete analysis of the molecular weight distribution by SEC using triple detection Brugnerotto et al., 2001 (viscosity, concentration, molecular weight) was reported. The samples under investigation were heterogeneous chitosans : some were from commercial sources after solid-state treatment ; others were some homogeneous chitosans of different molecular weights obtained by re-acetylation of a highly deacetylated chitosan.Roberts & Domszy, 1982 The DA of these acid-soluble chitosans varied from 0.02 to 0.61. The data confirm that the stiffness of the chain is nearly independent of the DA and demonstrate that the other descriptors (including the persistence length) depend only slightly on the DA. The relationship obtained between the intrinsic viscosity [η] and the radius of gyration Rg and the molecular weight is :
[η](mL/g) = 0.0843M0.92 and Rg(nm) = 0.075 M0.55
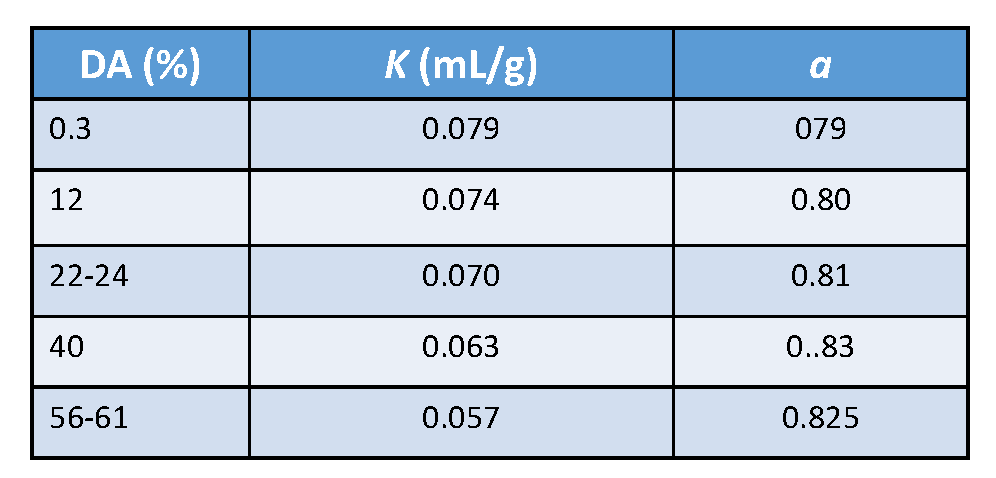
Within a window covering the total range of DA, average values for the Mark–Houwink were established ; their validity holds for heterogeneous as well as for homogeneous samples

The relatively high values for the parameter “a” agree with the semi-rigid character of this family of polysaccharides. Computer simulation performed on chitin, and chitosan confirmed this conclusion,Mazeau et al., 2000; Mazeau & Rinaudo, 2004 in agreement with the experimental results obtained by SEC. It is important to mention the usual method of preparing chitosans with various molecular weights using nitrous acid in dilute HCl aqueous solution.Allan & Peyron, 1995 The influence of the ionic strength on the Mark–Houwink parameters K and a Rinaudo et al., 1993; Anthosen et al., 1993; Varum & Smidsrod, 2005 was also investigated. Two series of solvents were used : 0.3M acetic acid/variable Na acetate content and 0.02M acetate buffer (pH=4.5) buffer with various concentrations of NaCl. This experiment allowed the determination of the relationship between the intrinsic viscosity and the salt concentration. From these experimentally determined values, the extrapolation to infinite ionic strength is used to approach the θ-conditions.
9.2. Persistence Length
The semi-rigid nature of the polysaccharide chains dictates the dimensions of chitosan chains, their related hydrodynamic volume and ultimately, their viscometric contribution. Since chitosan in an acid medium is a polyelectrolyte, the ionic con-centration influences these properties. This point can be addressed using static and dynamic light scattering experiments in the dilute and semi-dilute regimes.Bulher & Rinaudo, 2000; Buhler et al., 2000 The actual persistence length Lt at a given ion concentration results from an intrinsic contribution Lp and an electrostatic contribution Le calculated following Odijk’s treatment.Odjik, 1979 The worm-like model for a semi-flexible chain has been developed by several groups and successfully applied to polysaccharides.Rinaudo et al., 1993; Brugnerotto et al., 2001; Reed, 1984 A computer simulation performed on chitin and chitosan having a different degree of acetylationMazeau et al., 2000; Mazeau & Rinaudo, 2004confirmed the semi-rigid nature of chitin and chitosan. The calculated persistence length (asymptotic value obtained at a high degree of polymerization) depends moderately on the DA of the polysaccharide. From this analysis, chitosan without acetyl groups has an intrinsic persistence length Lp = 9 nm at 25°C when the electrostatic repulsion is screened. Lp increases as DA increase up to Lp =12.5 nm for DA= 0.60, then remains constant up to pure chitin. The local stiffness is related to the conformation of the molecule, and especially to the intra-chain H bond network formed. The decrease of the stiffness of chitosan as temperature increases, as shown by 1H NMR Brugnerotto et al., 2001, agrees with the prediction from molecular modeling. A critical temperature around 40°C is found where Lp starts to decrease more rapidly ; this behavior relates to the destabilization of H bonds as the temperature increases. The difference in Lp values between experiment and prediction is not dramatic for chitosan, and it is difficult to determine for chitin because of its low solubility. The decrease of the stiffness of the chitosan chain when the DA decreases have been confirmed and analyzed in terms of the destabilization of the local conformation by intra-chain H bonds.Fang et al., 2015
The stiffness of the chain contributes to the rheological behavior of the polysaccharide. Even in dilute solution, the stiffness influences the formation of interchain H-bonds throughout the creation of multimeric assemblies that perturb all characterization of these polysaccharides. The aggregation has been discussed and analyzed ; it seems that H-bonds, as well as hydrophobic attractions, have a role, irrespective of the DA.Philippova et al.. 2001
9.3. Rheology
The rheological behavior of polymeric solutions is generally characterized using flow and dynamic measurements. Flow experiments. In this type of experiment, the viscosity is determined as a function of the shear rate at a constant temperature. Usually, the viscosity increases when the shear rate decreases, going to a Newtonian plateau at low concentration. The viscosity obtained at zero shear rate on the diluted and semi-diluted solution of the polymer has been studied. A general relationship could be proposed for perfectly soluble polymers in good solvent relating the specific viscosity at zero shear rate to the polymer concentration and molecular weight ex-pressed by the overlap parameter C[η] :
(ηsp)0 = C[η] (1 + k1(C[η]) + k2(C[η])2 + k3(C[η])3}
with K1 = 0.4 ; K2 = (K1)2/2 ! ; K3 = (K1)3/3 !
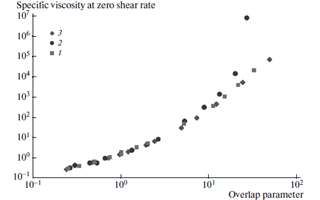
These parameters are used to establish a master curve valid for all the polymers, whatever is the Mw and the polymer concentration. Solutions obtained with chitosan in acetate buffer and hyaluronan in 0.1M NaCl at different polymer concentrations were studied to establish the experimental dependence of the specific viscosity at zero shear rate on the overlap parameter (Figure 15) :

As seen on this figure, hyaluronan a perfectly soluble polysaccharide fits with the theoretical prediction. On the opposite, when the overlap parameter is larger than 10 (i.e., in semi-diluted solution), the viscosity increases more sharply (look at the points • ) indicating some aggregation when polymer con-centration increases. Mazeau & Rinaudo, 2012 This aggregation was discussed previously. Philippova et al., 2012
From flow experiments, the determination of the intrinsic viscosity [η] obtained at zero concentration and zero shear rate, allows accessing to the viscometric-average molar mass Mv using the Mark Houwink relationship determined in the same solvent at the same temperature.Brugnerotto et al., 2001; Rinaudo, 2006
Dynamic experiments. In the linear viscoelastic regime, a steel cone-plate geometry rheometer is used. The storage (G′) and the loss modulus (G″) as a function of the angular frequency (omega) are determined at a constant temperature. On polymeric solution, one obtains usually G’ < G’’ a (as a function of ω) at low frequencies. These curves cross at given ω0 which decreases when polymer concentration increases. Chitosan solutions in good solvent have the normal behavior of the polymer solution. This behavior is described on xanthan dissolved in 0.1M NaCl aqueous solution.Milas et al., 1990
