
The RICM technique was first introduced to study cell adhesion, in particular for the visualization of the area of the cell attached to the surface in the focal adhesion site Curtis, 1964. In the 1980s, Sackmann et al. demonstrated that the distances between a planar transparent substrate and spherical objects, like a colloidal bead, hovering over the substrate can be well quantified by RICM Kuhner & Sackmann, 1996Radler & Sackmann, 1997Schiling et al., 2004. We applied colloidal probe RICM to determine the thickness of the HA films modified by proteins. Moreover, tracking the normal and lateral displacement of HA functionalized beads hovering above a planar HA film provided insight into interactions, such as cross-linking in and between HA assemblies.
The working principle RICM is based on the interference of light reflected from different interfaces (Fig. 3).
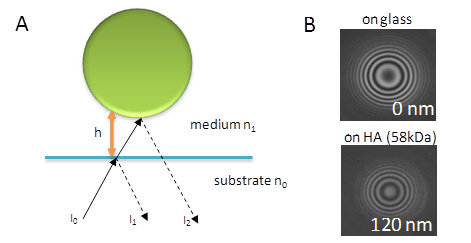
The incidence light is first partly reflected at the glass/medium interface. The transmitted light is further partly reflected at the colloidal probe/medium interface. The reflected beams interfere and give rise to a pattern, so-called Newtonian rings of maximum (Imax) and minimum intensity (Imin). The relation between the intensity distribution and height of the bead above the surface is given by:

where h(x,y) is the distance at a given lateral position with coordinates x and y, nb is the refractive index of the medium, δ is the phase shift of the reflected light and λ is the wavelength.
Reconstruction of the film thickness For a colloidal probe of spherical geometry, the interference pattern consists of circular fringes. The intensity in the center changes as the distance between probe and substrate varies (Fig. 4A).
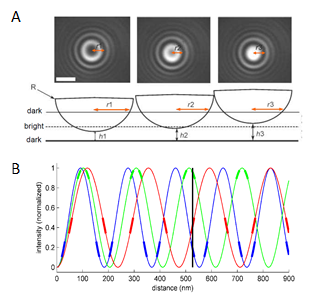
The radius rl from the center at which an extremum (maximum or minimum) occurs can be calculated with good accuracy from the radially averaged intensity profile. The probe-substrate distance can then be derived from the radial position of the selected extremum:

and
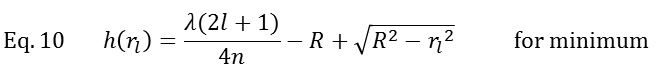
where R is the radius of the bead, and l is the fringe order (which needs to be appropriately chosen).
Dual-/Triple –wavelength RICM From equations 9 and 10, it is obvious that the distance measured by RICM is not unambiguously defined. The RICM intensity response as a function of probe-substrate distance is periodic (Fig. 4B), and several solutions are possible. Under the experimentally relevant conditions, the periodicity is on the order of a few 100 nm, but depends on the wavelength. Correlation of RICM data at multiple wavelength, therefore, enable unambiguous distance determination over a distance range that is much larger than the periodicity (Fig. 4B). With triple-wavelength RICM the absolute height can be determined over a distance range of more than 1 micrometer with an accuracy of a few nanometers Attili,et al., 2012Richter et al., 2007Schiling et al., 2004Attili & Richter, 2012.
Mean squared displacement The thermal motion of the colloidal bead hovering above the HA film in the x, y and z directions can be quantified by RICM with nm resolution. The thermally driven motion of the colloidal probe hence becomes detectable by microscopy. When unconstrained, the probe performs a random walk in x and y due to Brownian motion. The average of the squared distance which the bead has moved in, for example, the x direction within a given time step τ, the so-called mean square displacement (MSD),is given by:
![]()
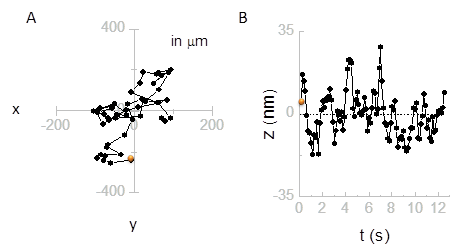
The MSD is a measure of the mobility of the probe, and can be correlated to diffusion. (Fig. 5). Sengupta et al. used the calculation of the MSD (in z direction) by colloidal probe RICM to characterize the viscoelastic properties of HA films Sengupta et al., 2003
Schematic representation of the RICM working principle. A. The incidence beam with intensity I0 is partly reflected from the substrate interface (bare glass or glass covered with a thin transparent gold layer) and partly from the surface of a colloidal bead. The reflected beams with intensities I1 and I2 interfere and give rise to an interference pattern. B. Interferographs of a colloidal bead sitting on the glass surface or on an HA-film of approximately 120 nm thickness, respectively.