The STD NMR experiment (Mayer & Meyer, 1999) is another spectroscopic technique to study the interactions, in solution, between a large molecule (receptor) and a medium-small sized molecule (ligand), and, alike tr-NOESY, it is based on the Nuclear Overhauser effect and the observation and analysis of the resonances of the ligand protons.
The experiment is carried out by first registering a reference spectrum under conditions of thermal equilibrium with the irradiation frequency set at a value that is far from any ligand or protein signal (e.g. 40 ppm), i.e, the so-called off-resonance spectrum (Fig. 7, top), which is used as reference with signal intensities I0. A second experiment is then recorded, in which the protein is selectively saturated (on-resonance spectrum; see Fig. 7, middle), giving rise to ligand signals with Isat intensities. In general, the selective irradiation consists of a cascade of Gaussian-shaped pulses (low power) that saturate only a region of the spectrum that contains a few protein resonances (but not ligand signals), e.g., the aliphatic (from 0 to -1 ppm) or aromatic region (around 7 ppm), for a specific period of time (saturation time; typically from 0.5 to 5-6 seconds). The selective saturation is transferred to the whole protein via spin diffusion through the vast network of intra-molecular 1H-1H cross-relaxation pathways (intra-molecular NOE; see Fig. 7, middle), being a quite efficient processes due to the typical large molecular weight of the receptor. Also, saturation is transferred from the protein to the bound ligand via spin diffusion through inter-molecular NOEs. The dissociation of the ligand will then transfer this saturation into the bulk solution where it accumulates during the saturation time of the experiment, as a result of the much slower relaxation in the unbound that the bound state. In particular, as in fast-exchanging protein-ligand systems the enthalpic relaxation (R1) of fast-tumbling molecules (small) in the free state is much slower than the kinetic off-rate constant of binding (koff >> R1), the accumulation of ligands molecules containing some of their resonances perturbed (NOE of large molecule) results in the macroscopic detection of transferred saturation on the ligand signals in the saturated STD NMR spectrum (Isat; Fig.7, middle).
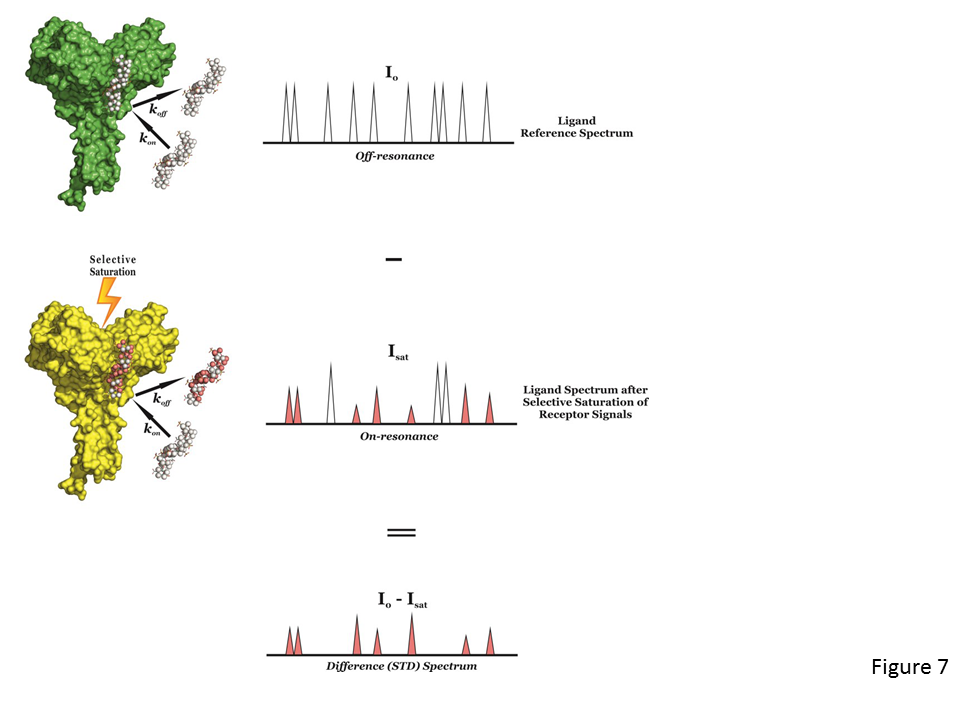
Furthermore, for those hydrogen atoms of the ligand establishing close contacts to the protein surface (4-5 Å) these Isat values will be lower than the I0 intensities, i.e, negative inter-molecular NOE, due to the transfer of the relaxation properties of the macromolecule to the small ligand in the bound state (Fig. 7, middle). By subtracting the off-resonance from the on-resonance spectrum (I0-Isat) the difference or STD spectrum is obtained, which will just contain the proton signals of the ligand in close contact to the protein surface (Fig. 7, bottom), and where any signal coming from non-binding compounds is cancelled out. So, if a non-binder is present in solution its resonances will not appear in the STD spectrum. The signal intensities exclusively coming from the saturation transfer can be quantified (ISTD = I0-Isat), showing the proximity (high ISTD) or distance (low ISTD) of the proton to the receptor surface. Also, a blank experiment must be carried out to assure the absence of direct irradiation of the ligand. A sample containing the receptor at low concentration and a large molar excess of the ligand (1:50 up to 1:1000) is usually employed in STD NMR experiments. This precludes the perturbations of absolute STD intensities due to rebinding effects (i.e, a ligand already saturated experiences another association process, without previous full relaxation), which would impede to correctly determine the group epitope mapping (Fig. 8).
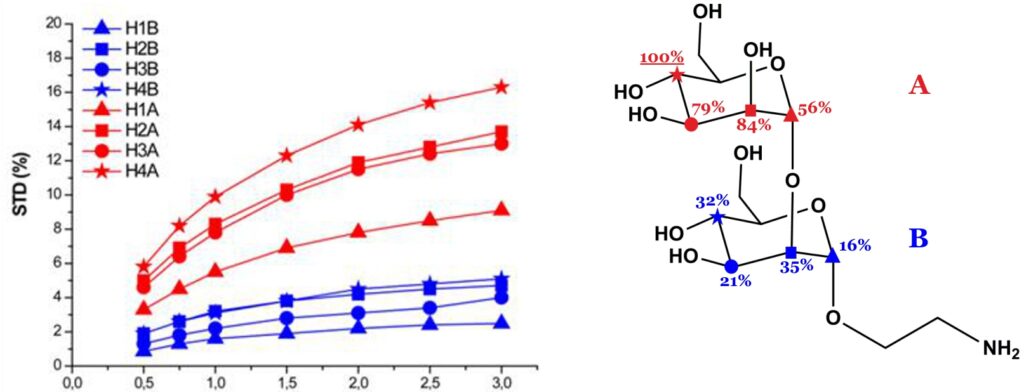
The theory of NOE indicates that the magnetization transferred from receptor to ligand protons by intermolecular NOE depends on the inverse sixth power of their distances in the bound state. Thus, the shorter the protein-ligand proton-proton distance (bound state), the stronger the intensity of the corresponding STD signal. So, by normalizing all the measured STD intensities (I0-Isat/I0) against the most intense signal (which is arbitrarily assigned a value of 100%), the so-called “group epitope mapping” is obtained (expressed as percentages; see Fig. 8). This represents the fingerprint of protein-ligand contacts in the bound state, such that it illustrates which chemical moieties of the ligand are key for molecular recognition in the binding site.
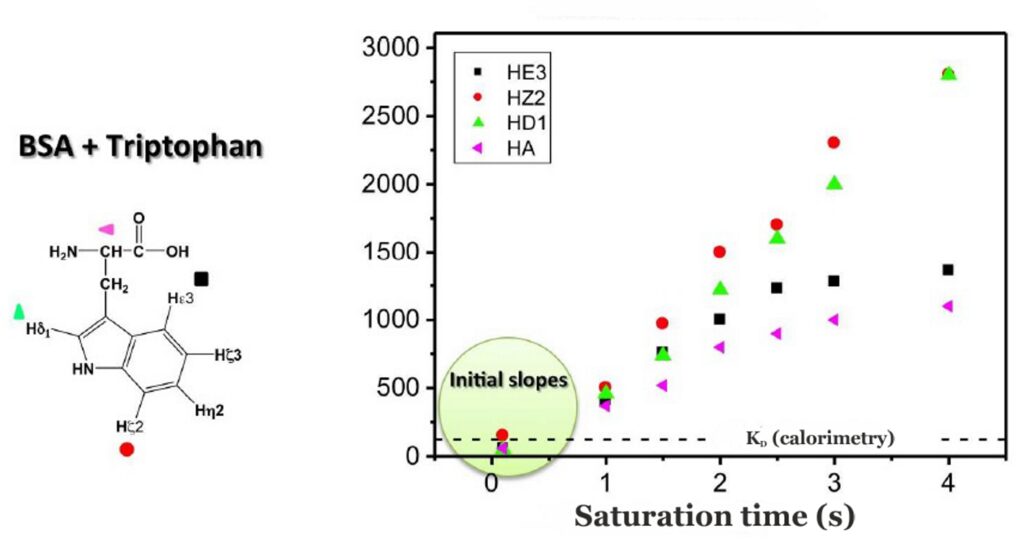
Binding epitopes were commonly obtained for a given saturation time, assuming that the resulting ligand group epitope mapping did not depend on the chosen saturation time. However, significantly different R1 relaxation rates of the ligand protons can produce artefacts in the epitope definition (Yan et al., 2003). In particular, protons with slower longitudinal relaxation enable a more efficient accumulation of saturation in solution such that their relative STD intensities may be significantly overestimated at long saturation times, thus also overrating the proximity of those protons to the protein surface. Indeed, the structural information that the binding epitope provides can be affected by 1) differences in R1 relaxation rates of ligand protons, 2) the extent of saturation received in the first place, and 3) the kinetics of binding. Since these sources of distortions are the consequences of differences in the ability to accumulate saturation in the free state, we can cancel them by deriving STD intensities close to zero saturation time, this is, when virtually no accumulation of saturated ligand molecules is taking place. This is usually referred to as initial slopes of the build-up curves (Fig. 9). In addition, under this approximation, possible artefacts coming from intra-molecular spin diffusion (bound state) can also be minimized. To calculate the initial slopes, Mayer and James proposed fitting the experimental build-up curves to the mono-exponential function (Mayer & James, 2004).

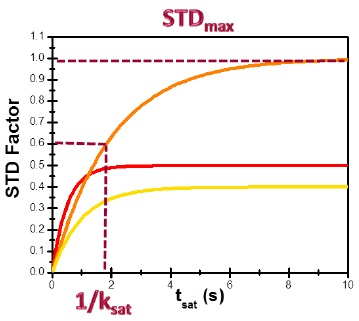
where STD(tsat) is the observed STD intensity, STDmax is the asymptotic maximum of the build up curve, tsat the saturation time, and ksat the rate constant related to the relaxation properties of a given proton that measures the speed of the STD build-up. ksat and STDmax are derived by least-squares fit, and the initial slope (STD0) of the curve is obtained as
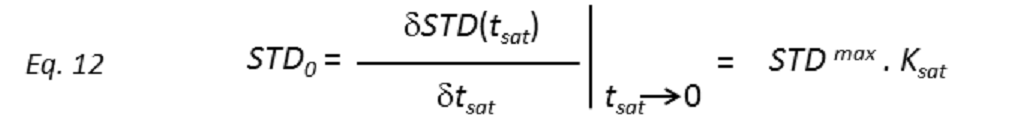
These STD0 values are then used to characterize the binding epitope independently of T1 and rebinding effects. Note that for
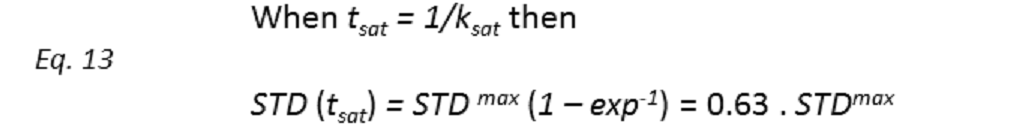
Thus, if we plot the normalized STD factor versus the saturation time (tsat), ksat can be approximated as the inverse of the interpolated tsat value from a STD factor of 0.63 (Fig. 9).
This approach can be used to quantify cases of multiple binding modes and can account for the contribution of such different binding modes involving either the same lingand or different binding sites.
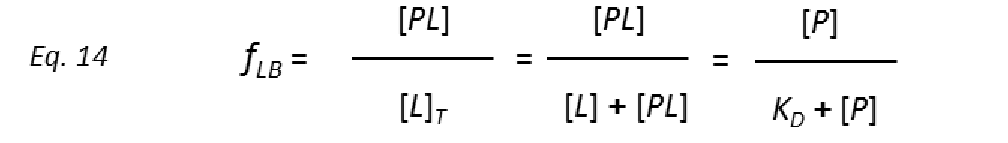
To get protein-ligand association curves from STD NMR experiments, Mayer and Meyer introduced the conversion from observed experimental intensities (I0-Isat/I0), which depend on the fraction of bound ligand fLB.
to STD amplification factors (STD-AF) by multiplying the observed STD by the molar excess of ligand over protein (Mayer & James, 2004.).
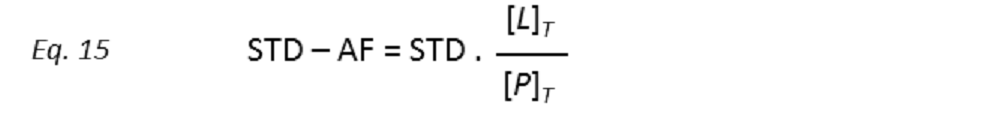
so that the STD amplification factor (STD-AF) depends on the fraction of bound protein (fPB).
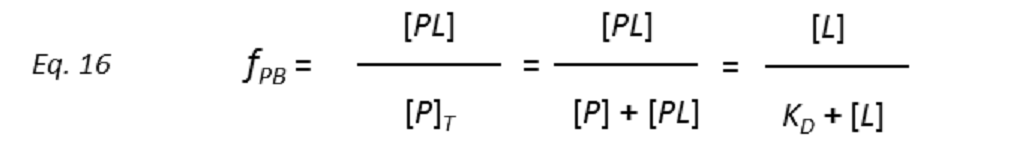
Therefore, a plot of STD-AF values at increasing ligand concentrations will give rise to the protein-ligand binding isotherm, from which the dissociation constant KD can be derived. However, in eq. 16 the concentration of free ligand [L] is not known. This can be solved by employing a very low total concentration of protein, such that [P]T << KD, and an excess of ligand. Under these conditions [ L] can be approximated to [L ]T , so that
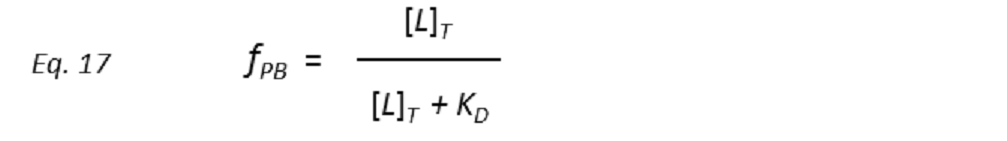
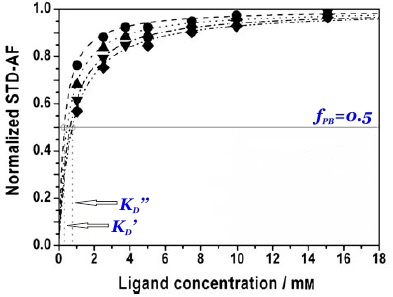
and thus the dissociation constant KD can be easily determined by plotting the normalized STD-AF values at increasing total ligand concentrations, i.e, the binding isotherm (Fig. 10). This can be done graphically by interpolation as the KD coincides with the amount of ligand [L ]T that is necessary to reach a 50% of fPB ( fPB = 0.5)
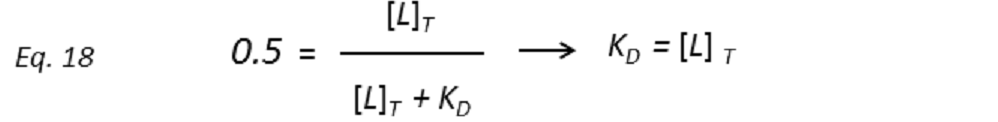
Therefore, the weaker the interaction, the higher the ligand concentration required to saturate half of the protein molecules.
The determination of KD from STD-NMR experiments is affected by different experimental parameters (Angulo et al., 2010). In particular, the saturation time (tsat) employed (Fig. 10 and 11), the STD intensity of the signal (Fig. 11) and the fraction of bound ligand are key factors that must be chosen wisely for the accurate determination of dissociation constants. The apparent KD increases monotonically with tsat, thus understimating the protein-ligand affinity. Similarly, the higher the STD intensity of a resonance the more overestimated KD value will be obtained. Also, if the fraction of bound ligand is modified by increasing the receptor concentration, the apparent dissociation constant will be larger.
Therefore, the precise quantitation of the dissociation constant implies the cancelation of all the effects comingfrom the fast ligand rebinding process. As the effects are related to the accumulation of saturated ligand in the bulk solution, the way to fix it is to obtain the KD value in the absence of such accumulation, i.e. monitoring the STD in the vicinity of zero saturation time. As in the cases of determination of ligand epitopes, this requires the determination of the initial slopes of the build-up curves of STD-AF values with saturation time.
The method of STD-AF initial growth rates for KD determination involves recording a STD-AF build-up curve (STD-AF versus saturation time) for each ligand concentration, then obtraining the initial slopes (STD-AF0) and representing them graphically as a function of the concentration of added ligand calculating the KD from the obtained exponential curves.